A Revelation prophecy chart is a visual tool designed to organize the content of the biblical book of Revelation into a coherent timeline and symbol guide. It serves as a map for readers and students to track the sequence of visions, judgments, and symbolic figures that appear in the apocalypse. While some readers refer to this as a Revelation timeline chart, others call it an end-times diagram, a apocalypse chart, or an eschatology chart. Regardless of the name, the core purpose is the same: to translate dense apocalyptic language into a structured, visually digestible format without losing important symbolic meaning.
In practice, this kind of visual guide is used by pastors, teachers, students, and curious readers to compare interpretations, see how categories relate, and identify patterns that recur across the book. A well-designed chart highlights the major sections—judgments, battles, cosmic signs, and the climactic triumph of good over evil—along with the key symbols that recur throughout the text, such as the seals, trumpets, bowls, beasts, and the Lamb. When built thoughtfully, a Revelation prophecy chart can transform a dense, symbolic text into a navigable panorama that invites careful study.
Why a Visual Timeline Helps Understand Revelation
The appearance of multiple prophetic cycles in the same book—seals, trumpets, bowls, beasts, and heavenly visions—can feel overwhelming when read in a single sitting. A visual timeline or event map helps by:
Providing a chronological frame to distinguish sequential events from simultaneous visions.
Highlighting symbolic correspondences across scenes, such as judgments that escalate in intensity.
Showing how different interpretive frameworks approach the same text, which is helpful for comparative study.
Assisting memory and study by using color-coding, icons, and labeled panels.
When readers encounter the revelation prophecy chart, they are better equipped to understand why scholars debate certain elements and how various lines of interpretation coexist. Some readers prefer a futurist reading—seeing most events as future—while others favor a preterist or historicist lens; a good chart can accommodate multiple viewpoints through notes and alternative panels. The goal is not to force a single reading but to provide a framework for thoughtful discussion and personal reflection.
Core Symbols and Their Meanings
The symbolic language of Revelation is rich and multifaceted. A practical chart includes a symbol glossary that defines terms and shows how they connect across different scenes. Below are common categories you might see on a comprehensive Revelation charts set, along with brief explanations. Use these as a starting point for your own diagram.
The Seals, Trumpets, and Bowls
Seals (typically seven) often signal escalating judgments or divine testing. Each seal opened in Revelation 6–8 marks a distinct event or rider’s appearance, culminating in a broader upheaval.
Trumpets introduce a second series of judgments that intensify the crisis and reveal cosmic-scale disturbances on earth and heaven.
Bowls of God’s wrath complete the triad, intensifying judgments and bringing about decisive outcomes. Diagrammatic panels often align these cycles to demonstrate progression from warning to judgment to ultimate resolution.
In a chart, these cycles may appear in parallel rows or as three layered columns, with arrows indicating how one cycle informs or overlaps with another.
Beasts, Dragon, and the Lamb
Dragon represents a cosmic antagonist, commonly identified with Satan. It sets the stage for the rise of forces opposed to the divine will.
Beast from the sea and beast from the earth often symbolize political power and religious deception, respectively. In a chart, these figures are typically anchored to their prophetic mouthpieces and the outcomes they drive.
The Lamb symbolizes Jesus Christ in Revelation. Visual guides often place the Lamb at the center of triumph and redemption, guiding readers toward hope amid judgment.
Seven appears repeatedly as a symbol of completeness or totality (e.g., seven seals, seven trumpets, seven bowls).
Twelve and its multiples (12 tribes, 12 apostles) often represent God’s orderly plan for his people.
666 (the number of the beast) and 144,000 are emblematic numerals that invite careful interpretation and cross-reference across visions.
Annotation in a chart may explain how numbers function symbolically rather than numerically, helping readers avoid numerical over-precision that the text does not demand.
Cosmic Signs and Final Victory
Cosmic signs—bursts of light, earthquakes, celestial disturbances—signal decisive moments in the narrative.
All charts devote space to the climactic victory of the Lamb, the defeat of cosmic evil, and the establishment of a new heaven and new earth.
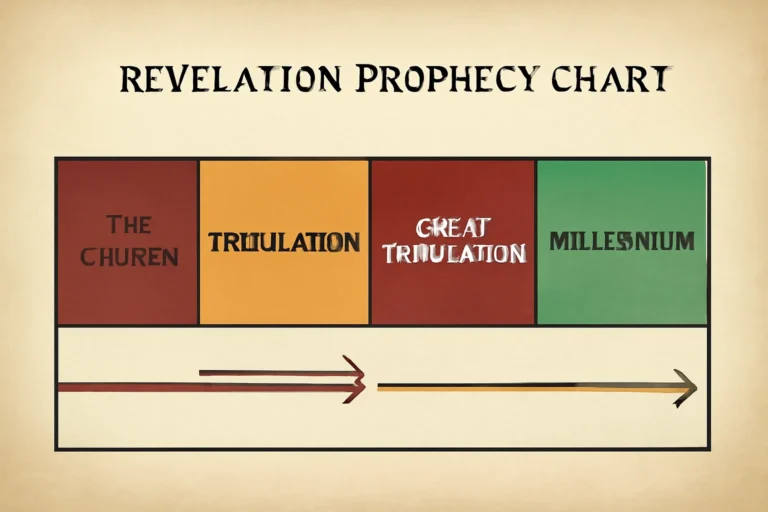
Timeline Structure: The Eschatological Narrative
A robust timeline chart of Revelation organizes events into stages that help readers see the overall arc. Although different traditions disagree about the exact timing and order of these events, many common structures emerge in popular diagrams.
Opening visions and the glorified Christ among seven golden lampstands establish the authority of the text and invite faithful contemplation.
Seals cycle introduces judgment and rider imagery, often interpreted as a progression from conquest to war, famine, death, and unrest.
Trumpets cycle deepens catastrophe, affecting nature and cosmic order, and prompting calls for repentance and endurance.
Bowl judgments reach a crescendo of divine wrath, culminating in dramatic upheaval.
Cosmic conflict and Satan’s defeat precede the return of Christ and the removal of evil from creation.
Millennial era (in many readings) provides a period of peace, judgment, and renewal, followed by the final judgment and a new creation.
In many diagrams, these stages are presented as a combination of horizontal timelines and vertical panels to indicate both sequence and emphasis. A well-designed chart includes notes that clarify areas of debate, such as the interpretation of timing and the symbolic meaning of numbers and figures.
It is also common to include separate interpretive lanes in a chart to reflect different approaches—futurist, preterist, historicist, and idealists. By presenting these lanes side by side, readers can compare how the same verses yield different conclusions about the same events.
Reading Patterns Across Eras
In a futurist lens, the bulk of prophetic events are imagined to occur in the future, closely aligned with a literal horizon of time yet to come.
Under a preterist view, many judgments are understood as fulfilled in the first centuries or as symbolic representations of spiritual realities.
The historicist approach reads Revelation as a sweeping view of church history, mapping events across the centuries to various symbolic landmarks.
The idealists tend to interpret Revelation as timeless spiritual truths, focusing on the symbolic meaning rather than precise chronology.
Common Formats for These Revelation Diagrams
When constructing a Revelation prophecy chart, you’ll find several practical formats that convey the material clearly. Each format has strengths for different audiences and purposes.
Horizontal timeline
A classic choice, the horizontal timeline lays events from left to right. This format emphasizes progression and escalation, making it easy to compare sequential stages such as the seals, trumpets, and bowls. Color coding or icon sets help readers distinguish judgments, messianic appearances, and climactic triumphs.
A circular layout encircling a central symbol (often the Lamb or Christ’s throne) can reflect the cyclical or concentric nature of Revelation’s vision. The outer ring may host a legend or a sequence of judgments, while inner rings display heavenly realities and earthly consequences.
Layered panels or a comic-strip flow
A multi-panel design with stacked layers can parallel the dramatic cadence of Revelation. Each panel can represent a moment of judgment, a prophetic sign, or a heavenly proclamation, with arrows showing how one panel leads into the next.
Some readers prefer a modular chart that can be rearranged. Modules might cover symbols, judgments, and outcomes, while a separate module focuses on interpretive pathways. This flexibility supports classroom teaching, personal study, or online publishing.
Design Tips for Reading and Building a Visual Guide
A well-crafted graphic of Revelation can be a powerful aid, but it also requires careful attention to accuracy, clarity, and sensitivity to diverse interpretations. Here are practical tips to consider when building a reading chart or study aid.
Define your audience and choose a format that matches their needs—academic, devotional, or classroom use.
Label clearly with a legend that explains symbols, colors, and abbreviations. Avoid assuming prior knowledge.
Use consistent symbolism to reduce confusion. For example, assign a single color to each major category (judgment, salvation, heavenly vision, etc.).
Differentiate interpretations with side notes or alternate panels. This helps readers see how various scholars approach the text without collapsing viewpoints into a single reading.
Be explicit about scope—which chapters and verses are included in each panel? Are some visions summarized or omitted for simplicity?
Incorporate cross-references to related biblical passages (Daniel, Ezekiel, Isaiah) where helpful to illuminate symbolism.
Provide a glossary of terms and symbols at the end, so readers can quickly review meanings as they study different sections.
Offer notes on timing where chronology is debated, including potential alignments with future events or symbolic timelines.
Additionally, consider accessibility: use readable typefaces, alt text for images, and high-contrast color schemes. A chart should illuminate the text, not obscure it. For digital formats, provide downloadable versions (PDF, SVG) that preserve layout for education and outreach.
Practical Examples of Revelation Charts
Below are several conceptual layouts you might encounter or create. Each example demonstrates how distinct design choices support the same material: a coherent narrative arc built from symbolic imagery.
Example A: Horizontal core-path with seven seals, seven trumpets, and seven bowls arranged in three parallel lines. Each line has two rows: one for the visual symbol (lion, horse, eagle, etc.) and one for the accompanying text that describes the corresponding judgment or vision.
Example B: Central theme with satellites where the Lamb sits at the center of the diagram. Surrounding rings show the cosmic conflict, the beast’s rise, the faithful witness, and the ultimate victory. Side panels explain the symbols and the interpretive options.
Example C: Circular chronology with radial segments for the seals, trumpets, and bowls, and inner rings for heavenly visions and final judgment. This format is particularly effective for visual learners who appreciate cyclic patterns in Revelation.
Example D: Layered interpretive lanes that place the same verses into multiple lanes (futurist, preterist, historicist, idealist) to help readers compare how different approaches interpret the same text side by side.
When assembling a practical chart, you might begin with a basic skeleton—titles for major sections, a legend, and a handful of symbolic icons. Gradually add more detail, such as cross-references to related passages, interpretive notes, and alternate timelines where appropriate. The goal is a clear, navigable diagram that invites careful study rather than prescriptive readings.
A Revelation prophecy chart is a learning aid, not a final authority. Different readers bring different theological lenses. A chart that acknowledges these differences while presenting a shared structure helps foster constructive discussion.
Identify the core sequence first: judgments, heralding signs, the cosmic conflict, and the climactic victory. Mastering this order makes it easier to place interpretive notes without losing the narrative flow.
Differentiate symbols from literal events—where the text uses imagery, readers should notice how a chart conveys symbolic meaning without asserting precise terrestrial correspondences where the text itself is ambiguous.
Use multiple interpretive lanes whenever possible. A chart that shows how a futurist view differs from a preterist one helps readers become critical thinkers rather than passive receivers.
Keep the final goal in view: Revelation ends with healing, justice, and the renewal of creation. A chart should emphasize that overarching message even as it catalogs judgment and conflict.
For researchers and educators, a Revelation map can become a teaching tool that aligns scripture with scholarly frameworks. It can also serve as a bridge for lay readers to engage with complex topics in a structured, approachable form.
While many readers find a well-made end-times chart helpful, there are common pitfalls to avoid. Awareness of debates prevents misinterpretation and supports more rigorous study.
Over-simplification of complex symbol systems can lead to a flattening of nuanced interpretive layers. Use qualifiers and notes where needed.
Forced chronology—insisting that all events must map to a linear time line can obscure the symbolic and visionary nature of the text.
Ignoring historical context—since Revelation was written in a specific historical milieu, charts should acknowledge how early Christian readers might have understood the text.
Exclusive reliance on one interpretive framework—embrace multiple viewpoints respectfully, especially in educational settings or public articles.
Resources for Further Study
If you want to deepen your understanding of Revelation and how to represent it visually, consider exploring a mix of scholarly resources, commentaries, and visual design guides. The following list is a starting point for readers seeking credible analysis and practical diagramming tips.
Academic commentaries on Revelation that discuss historical contexts, symbolic language, and interpretive differences.
Graphic resources and templates for prophetic diagrams, including vector graphics libraries and editable diagram formats.
Bible dictionaries and encyclopedias that explain recurring symbols, numbers, and motifs found in apocalyptic literature.
Joinable study guides that offer structured walkthroughs of Revelation passages and options for classroom discussion.
Whether you are building a classroom handout, a church bulletin, or a personal study aid, combining textual study with a visually oriented chart of Revelation can enhance comprehension and retention. The best charts are transparent in their design, rigorous in their explanations, and flexible enough to accommodate diverse interpretations.